Events
The Events page allows you to view and analyze all events recorded by the system for one or more plants within a selected time range. It is intended for operators.
What are events
An event represents information recorded by the system during plant operation. Events are grouped into three categories:
- Status indicate the operational state of a device or subsystem
- Alarm indicate alarms or abnormal conditions
- Command represent commands or actions executed on the system
All event types are displayed together in the same view.
Plant and time range selection
To view events, you must:
- Select one or more plants from the tree in the toolbar
- Select a time range through the available calendars in the toolbar
- Click Search events
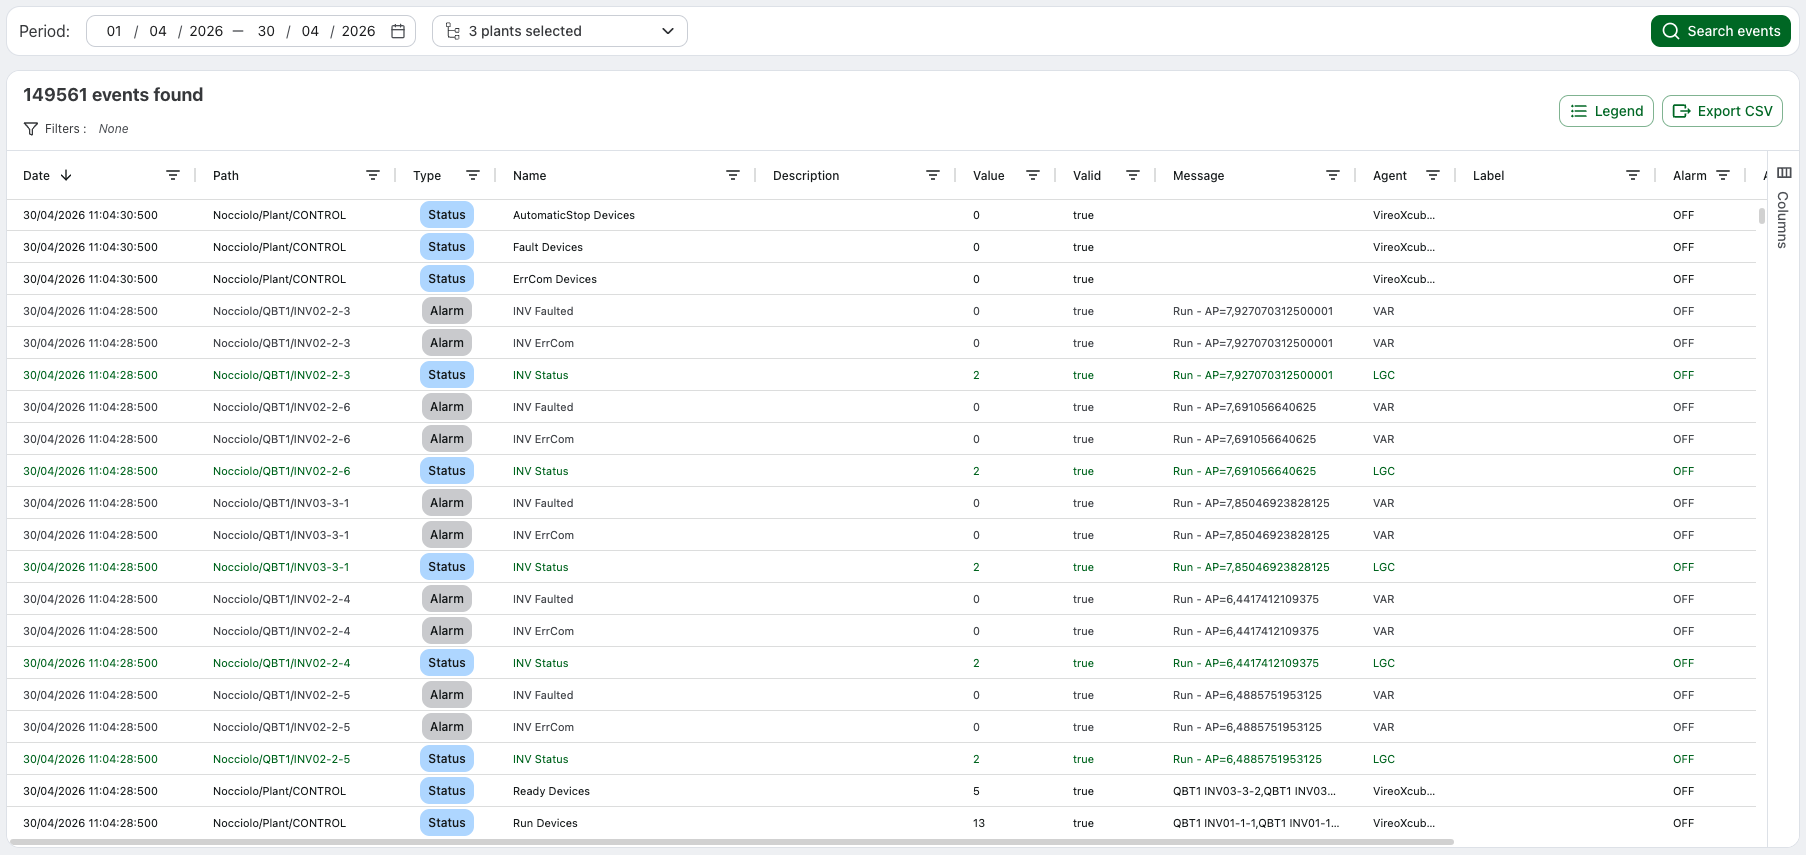
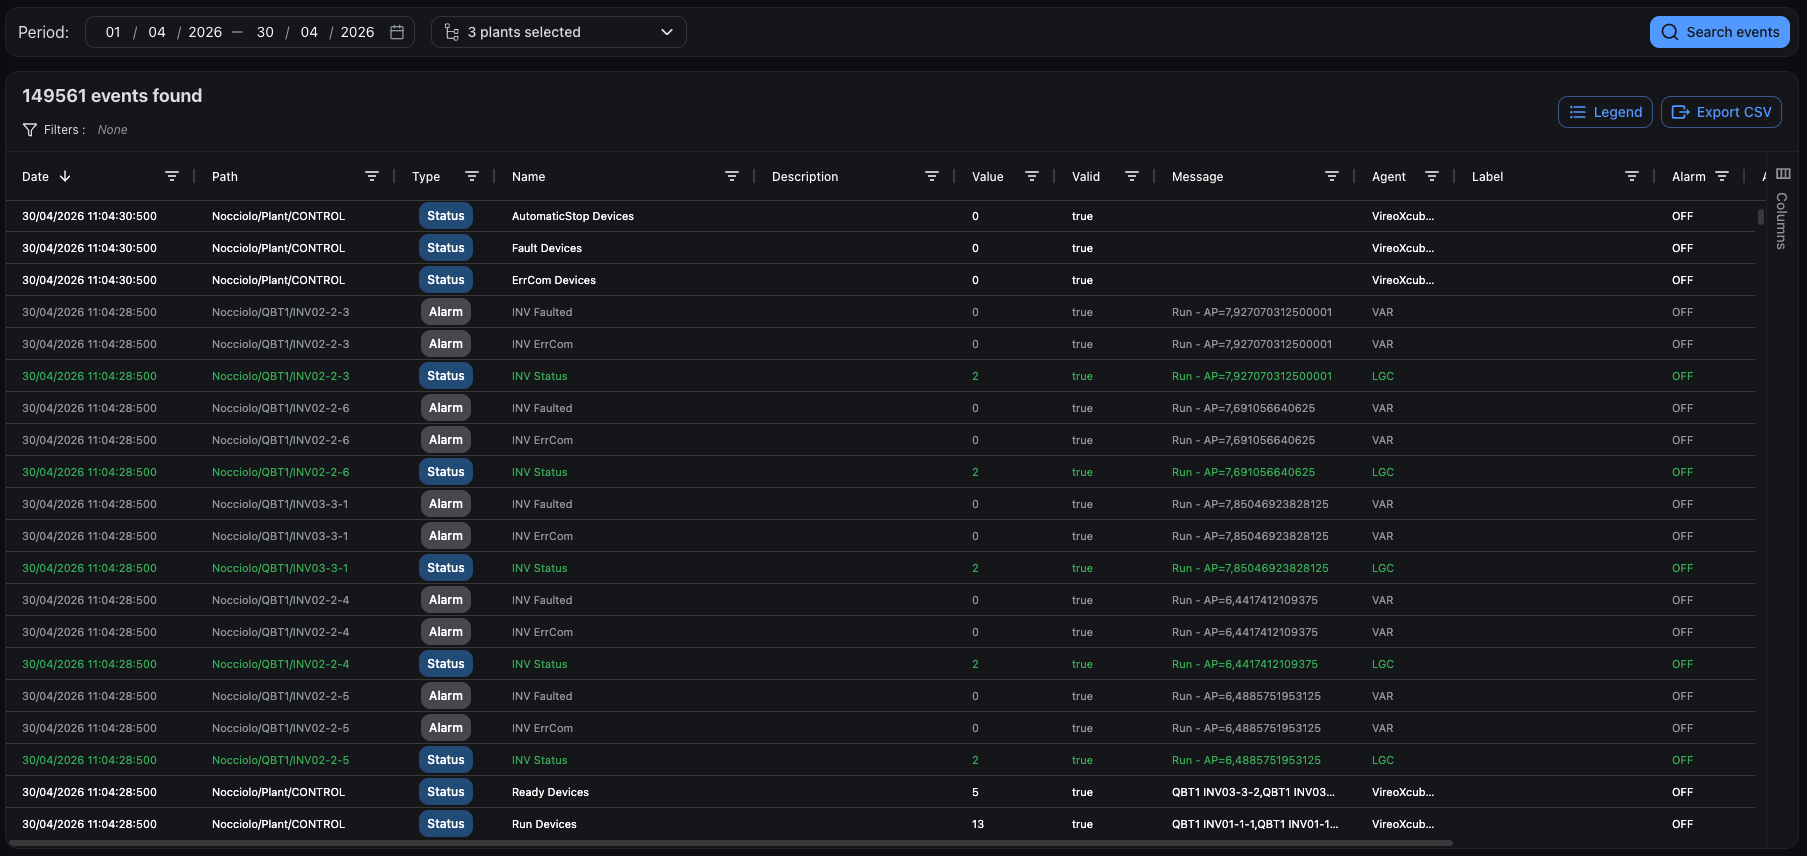
Event list
When you select one or more plants from the tree, the table displays all events recorded for those plants within the selected time range.
The total number of events found is shown above the table and updates based on applied filters.
Table columns
| Column | Description |
|---|---|
| Date | Date and time of the event with millisecond precision |
| Path | Full hierarchical path: Plant/Device/Tag name |
| Plant | Plant, registry field. Hidden by default |
| Section | Electrical distribution line the device belongs to. Hidden by default |
| Device | Device that generated the event (inverter, meter, turbine). Hidden by default |
| Type | Event type: Status, Alarm, Command |
| Name | Technical name of the event |
| Description | Extended description of the event |
| Value | Numeric value of the event |
| Valid | Indicates if the data was valid at the time of recording. Invalid data usually results from communication issues |
| Message | Additional message associated with the event |
| Agent | System that generated the event: Sp (Spontaneous - automatic data acquisition), DR (Data Retrieving - data recovery afterwards), DI (Data Import - manual import by operators) |
| Label | Description of the alarm's current state (e.g., "Switch open", "Switch closed") |
| Alarm | Alarm state: ON (active) or OFF (cleared) |
| Ack | Acknowledgment state: ON (operator has seen it) or OFF (needs attention) |
| User | Operator who interacted with the event (sent a command or acknowledged an alarm). Important field for traceability |
| Level | For Alarm: severity 1-5 (Very Low, Low, Medium, High, Very High). For Command: authorization level required to send the command |
Filters and navigation
Each table column has a filter accessible by clicking the icon in the header.
- The event counter above the table shows the number of events matching the applied filters
- The Filters indicator shows the number of active filters in parentheses (e.g., "Filters (3)")
- Active filter badges show the currently applied filters. Click the X on a badge to remove that specific filter
- To remove all filters: click the X icon next to the filter count
- Filters are applied in real-time on the table
Color legend
The page includes a legend explaining the meaning of the colors used. Click the legend icon in the toolbar to view it.
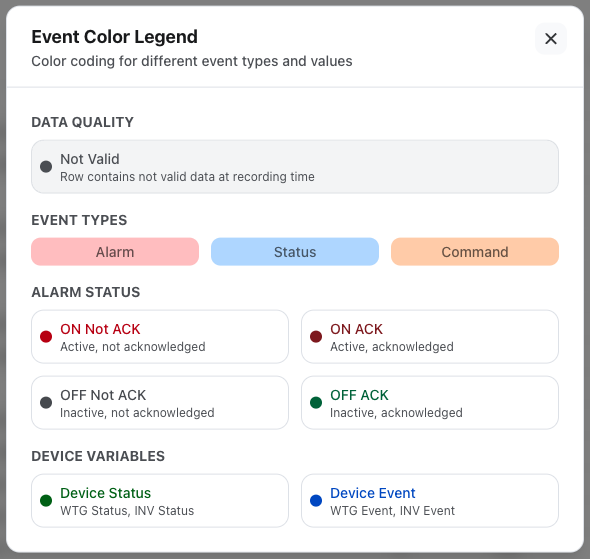
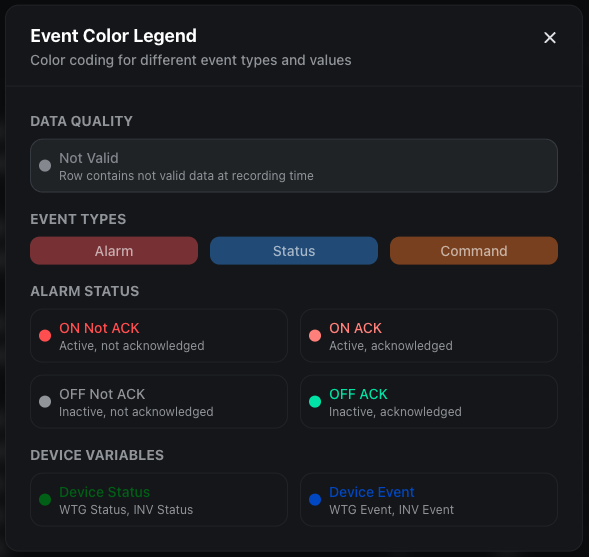
Data quality
- Not valid: the data was not valid at the time of recording (shown in gray)
Event types
Colored badges in the Type column:
- Alarm (red)
- Status (blue)
- Command (orange)
Alarm states
The row text color indicates the combined state of Alarm and ACK:
- ON - Not ACK: Active alarm, not acknowledged (bright red) - requires immediate attention
- ON - ACK: Active alarm, acknowledged (dark red) - operator has seen it
- OFF - Not ACK: Cleared alarm, not yet acknowledged (dark gray)
- OFF - ACK: Cleared and acknowledged alarm (green) - resolved situation
Command rows
- Command rows are highlighted with an orange background and text, making them easily distinguishable from other event types
Device variables
Some device-specific variables have dedicated colors, based on the Name field:
- Device Status (e.g., WTG Status, INV Status): device operational state - dark green
- Device Event (e.g., WTG Event, INV Event): specific device event - blue
These are abstractions that allow the system to work with device information independently of the underlying technology and manufacturer.
Data export
Displayed events can be exported in CSV format using the dedicated button. The export generates exactly what you see in the table:
- Filtered data: Only rows matching the active filters are exported
- Current sorting: Rows are exported in their current sort order
- Visible columns: Only visible columns are exported, in their current display order
Table customization
The events table includes a column management sidebar for customizing the table layout.
Frequently asked questions
What's the difference between Label and Description?
Description describes the alarm type (e.g., "Temperature alarm"). Label describes the alarm's current state (e.g., "Temperature high" or "Temperature normal").
Can I see who acknowledged an alarm or sent a command?
Yes, the User field shows the operator who acknowledged the alarm (ACK) or who sent the command.