Trend
The Trend page allows you to view and analyze historical data from device variables of configured plants, over a selected time range.
Device and variable selection
To view trend data, you must:
- Select one or more devices from the device tree on the left panel
- Select one or more variables from the tree at the bottom left
- Select a time range using the calendar in the toolbar
- Click View to display the selected pens on the chart
Union and Intersection
When multiple devices are selected, you can choose how to combine their variables:
- Intersection: shows only variables common to all selected devices (default)
- Union: shows all variables from all selected devices
Chart interactions
| Interaction | Description |
|---|---|
| Zoom | Drag on the chart area to select and zoom into a time range |
| Pan | Hold Shift and drag horizontally, or use the arrow buttons in the top-right corner |
| Reset Zoom | Click the reset button that appears after zooming |
| Tooltip | Hover over the chart to see values at a specific timestamp |
| Pin Tooltip | Double-click on the chart to freeze the tooltip at a specific point |
| Clear | Click the trash icon in the toolbar to remove all series from the chart |
Pinned tooltips
When you double-click on the chart:
- The tooltip is frozen at a specific timestamp
- A colored vertical line marks the position on the chart
- Values are displayed in a floating tooltip pinned on the chart
- You can drag the pinned tooltip to reposition it
- Click the X button on the tooltip to close it
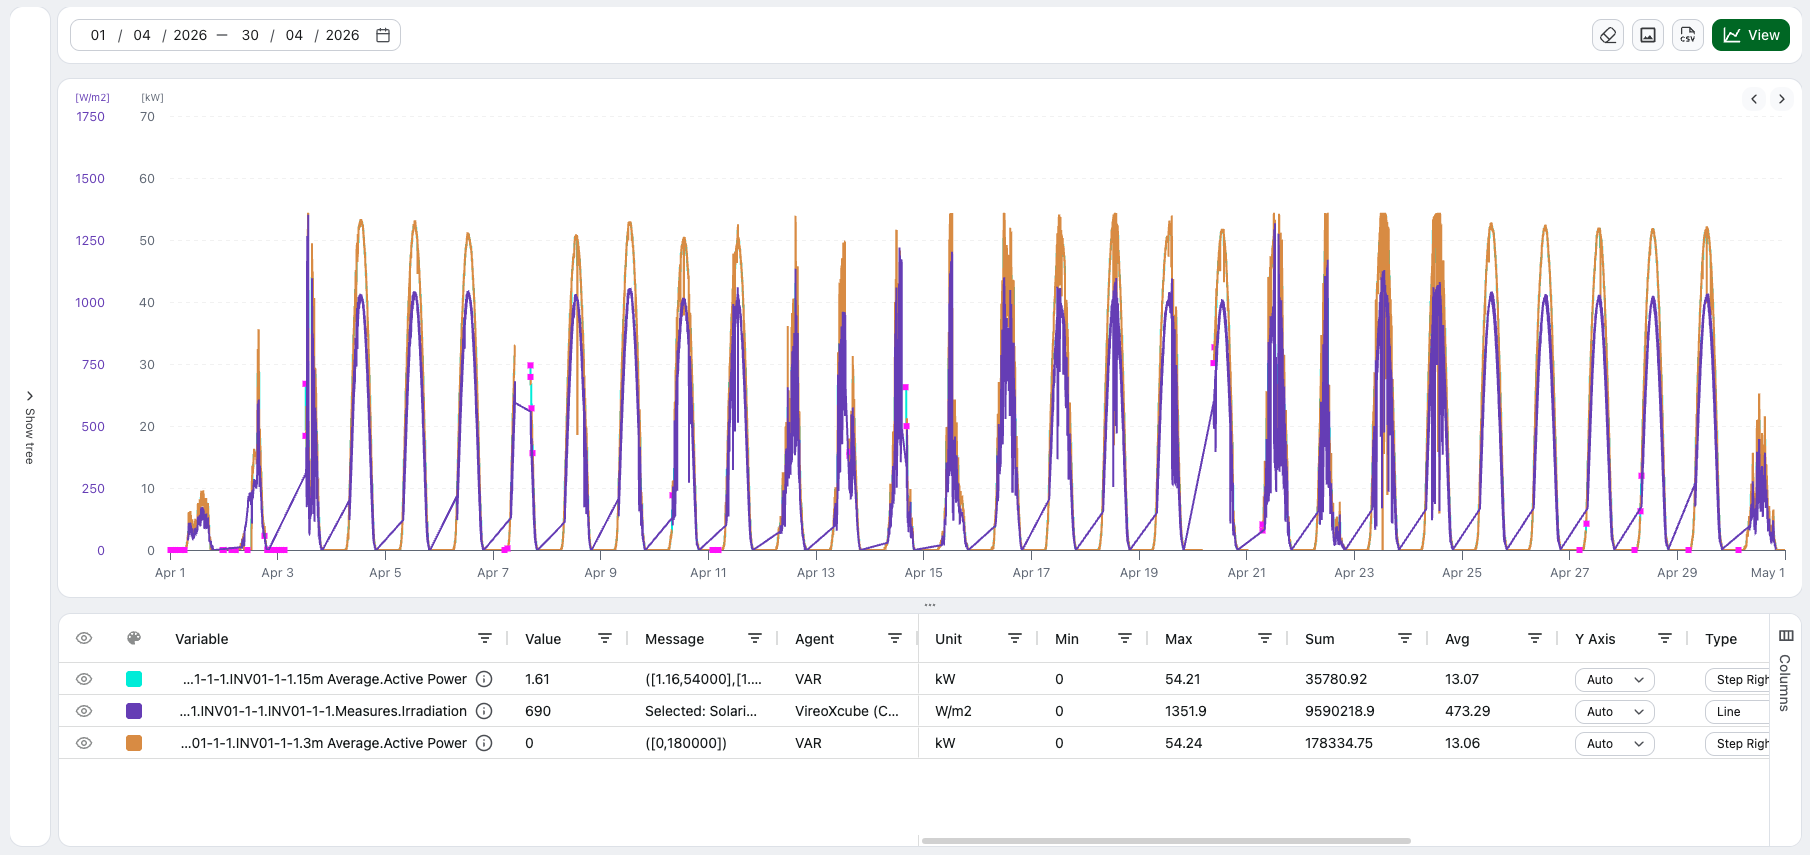
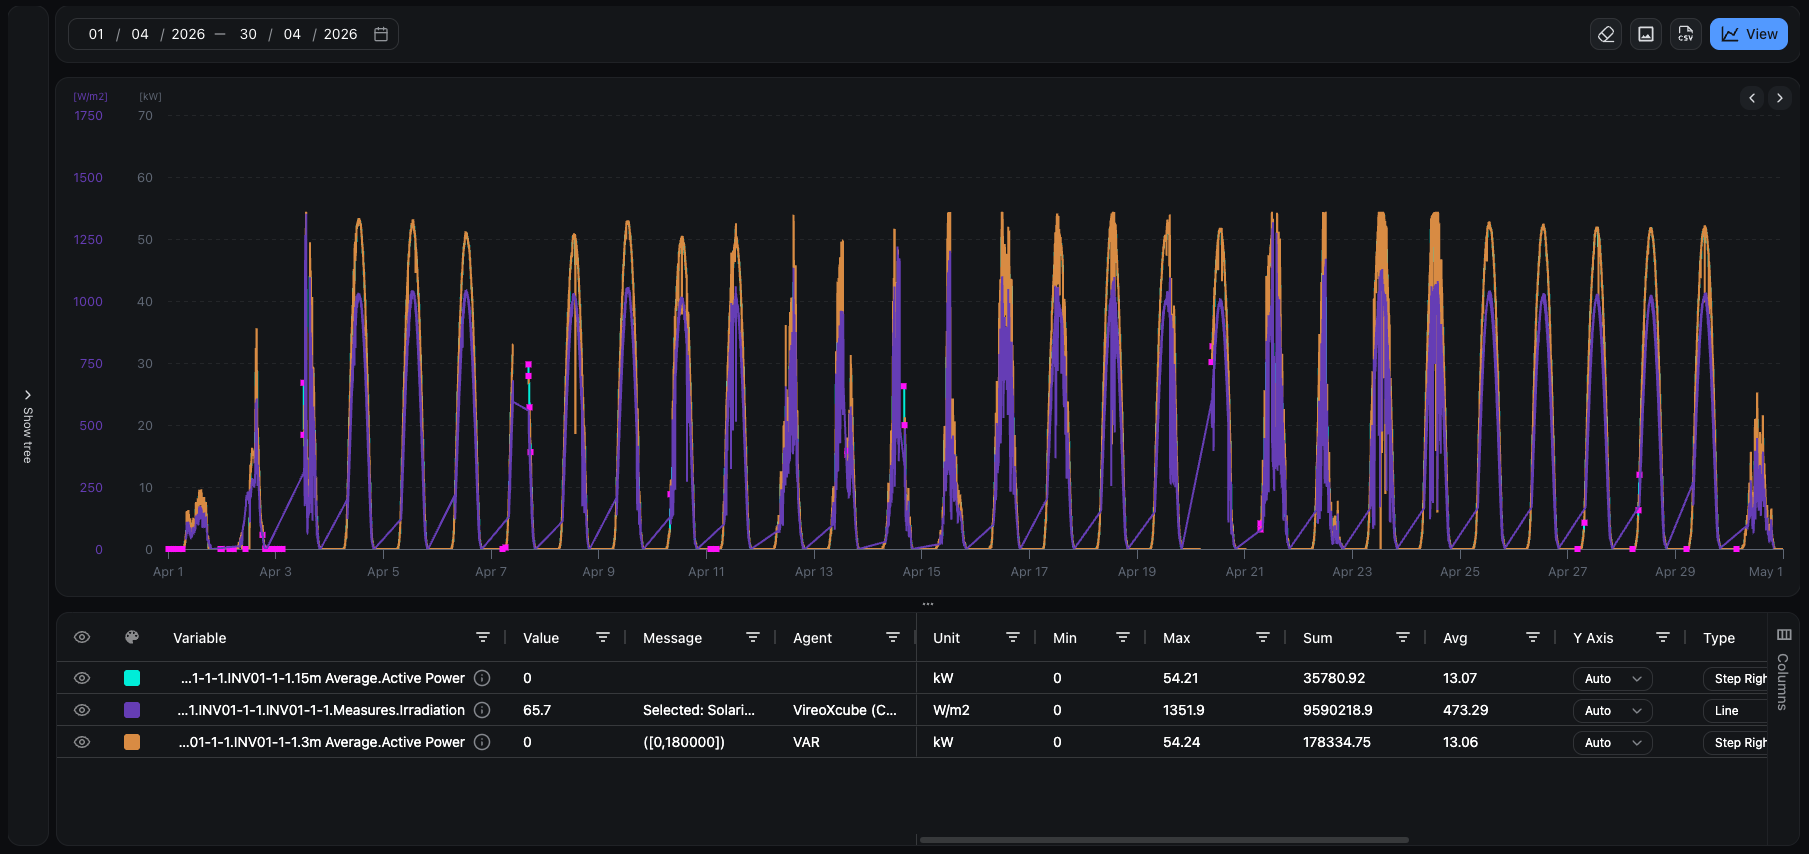
Summary table
The table below the chart shows one row per selected variable with real-time statistics.
Table columns
| Column | Description |
|---|---|
| Visible | Toggle to show/hide the series on the chart. Click the header icon to toggle all |
| Color | Series color. Click to open the color picker |
| Variable | Full path of the variable |
| Value | Value at the current cursor position or pinned point |
| Message | Additional message associated with the data point |
| Agent | Data source: Sp (Spontaneous), DR (Data Retrieving), DI (Data Import) |
| Unit | Unit of measurement |
| Min | Minimum value in the currently visible time range on the chart |
| Max | Maximum value in the currently visible time range on the chart |
| Sum | Sum of values in the currently visible time range on the chart |
| Average | Arithmetic mean in the currently visible time range on the chart |
| Y Axis | Axis assignment: Auto (variables automatically grouped by unit of measurement) or manual (1-9) |
| Type | Chart type for this series (Line, Column, Scatter, Area, Step Left, Step Right) |
| Style | Line style (Solid, Dash, ShortDash, Dot, DashDot, LongDash, and other combinations) |
| Width | Line thickness (1px, 2px, 4px) |
| Marker | Toggle to enable/disable markers on each point of the series |
Table customization
The summary table includes a column management sidebar for customizing the table layout.
Multiple Y-axes
Y-axis configuration is done through the Y Axis column in the below the chart.
By default, series are grouped by unit of measurement (Auto mode). Each unique unit gets its own Y-axis.
To manually assign series to specific axes:
- Change the Y Axis column value from "Auto" to a number (1-9)
- Series with the same number share the same axis
- When only one series is visible on an axis, the axis color matches the series color
Data export
Export as PNG
Click the image icon in the toolbar to export the current chart view as a PNG image.
Export as CSV
Click the CSV icon in the toolbar to export the data. The export includes:
- Date and time
- Variable name with unit of measurement (in the column header)
- Value
- Associated message (if any)
Panel management
- The Device/Variable Tree panel on the left can be resized by dragging its edge or by clicking the collapse icon to minimize it
- The summary table below the chart can be resized or collapsed
- Drag rows in the table using the designated column to reorder series in the chart legend. Only the first 10 series appear in the chart tooltip.