
Energy Production
The Energy Production page (at /kpi/energyProduction) compares, over a calendar year, the production of every production device of one or more plants against the fiscal counters of the associated Grid, when present, grouped by voltage level (BT, MT, AT).
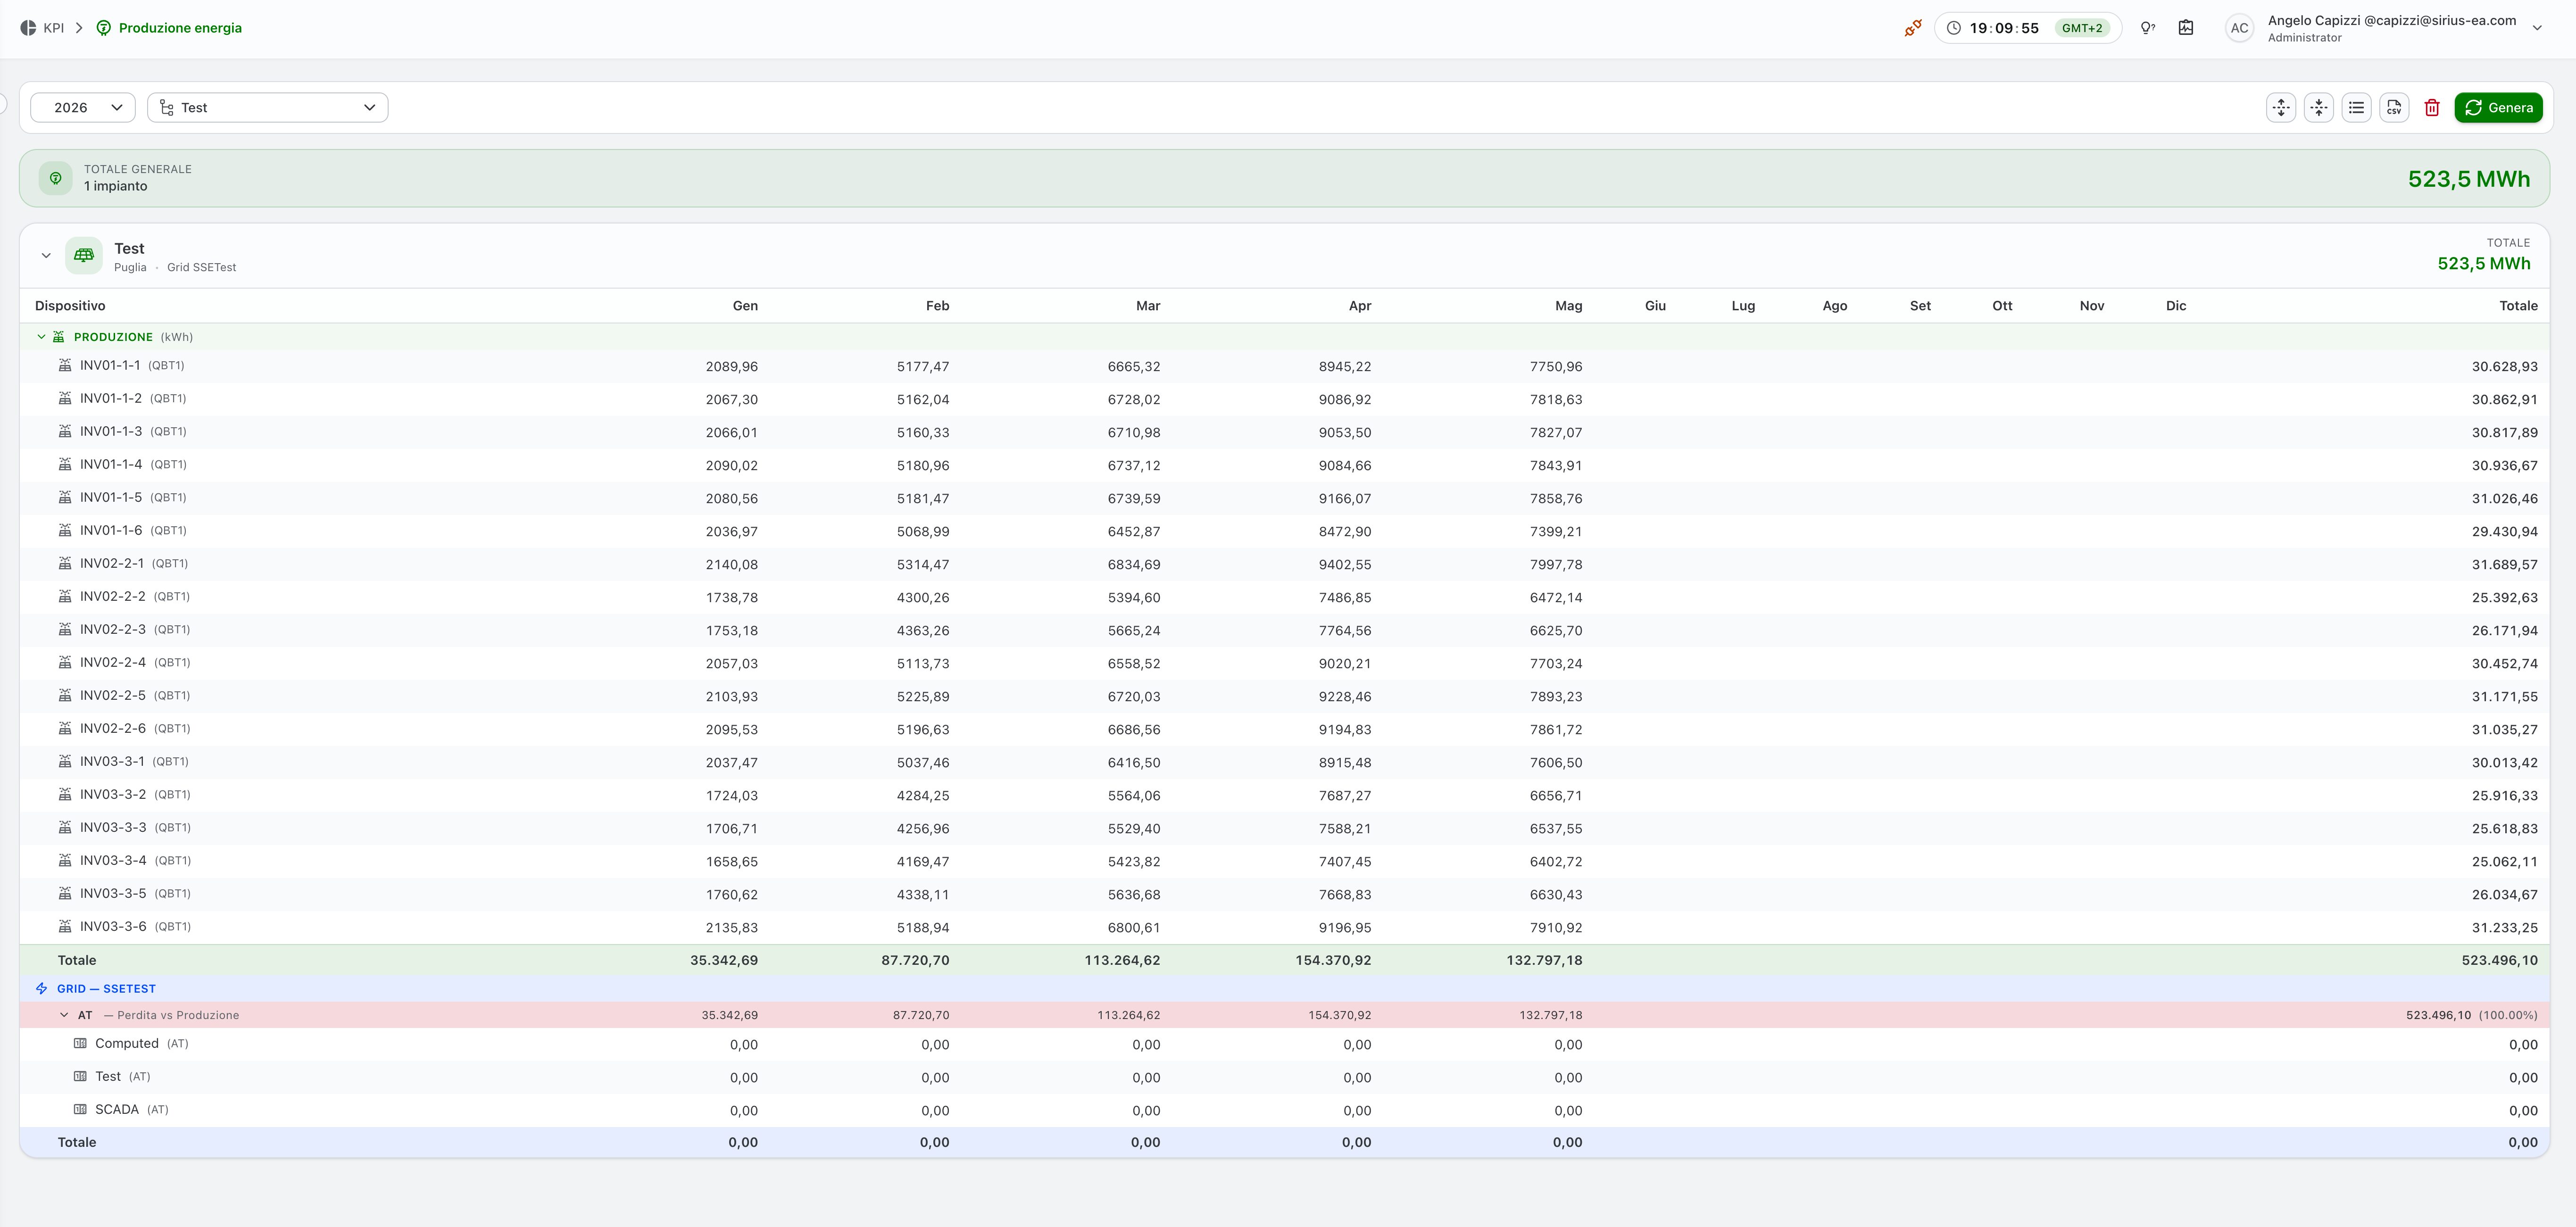
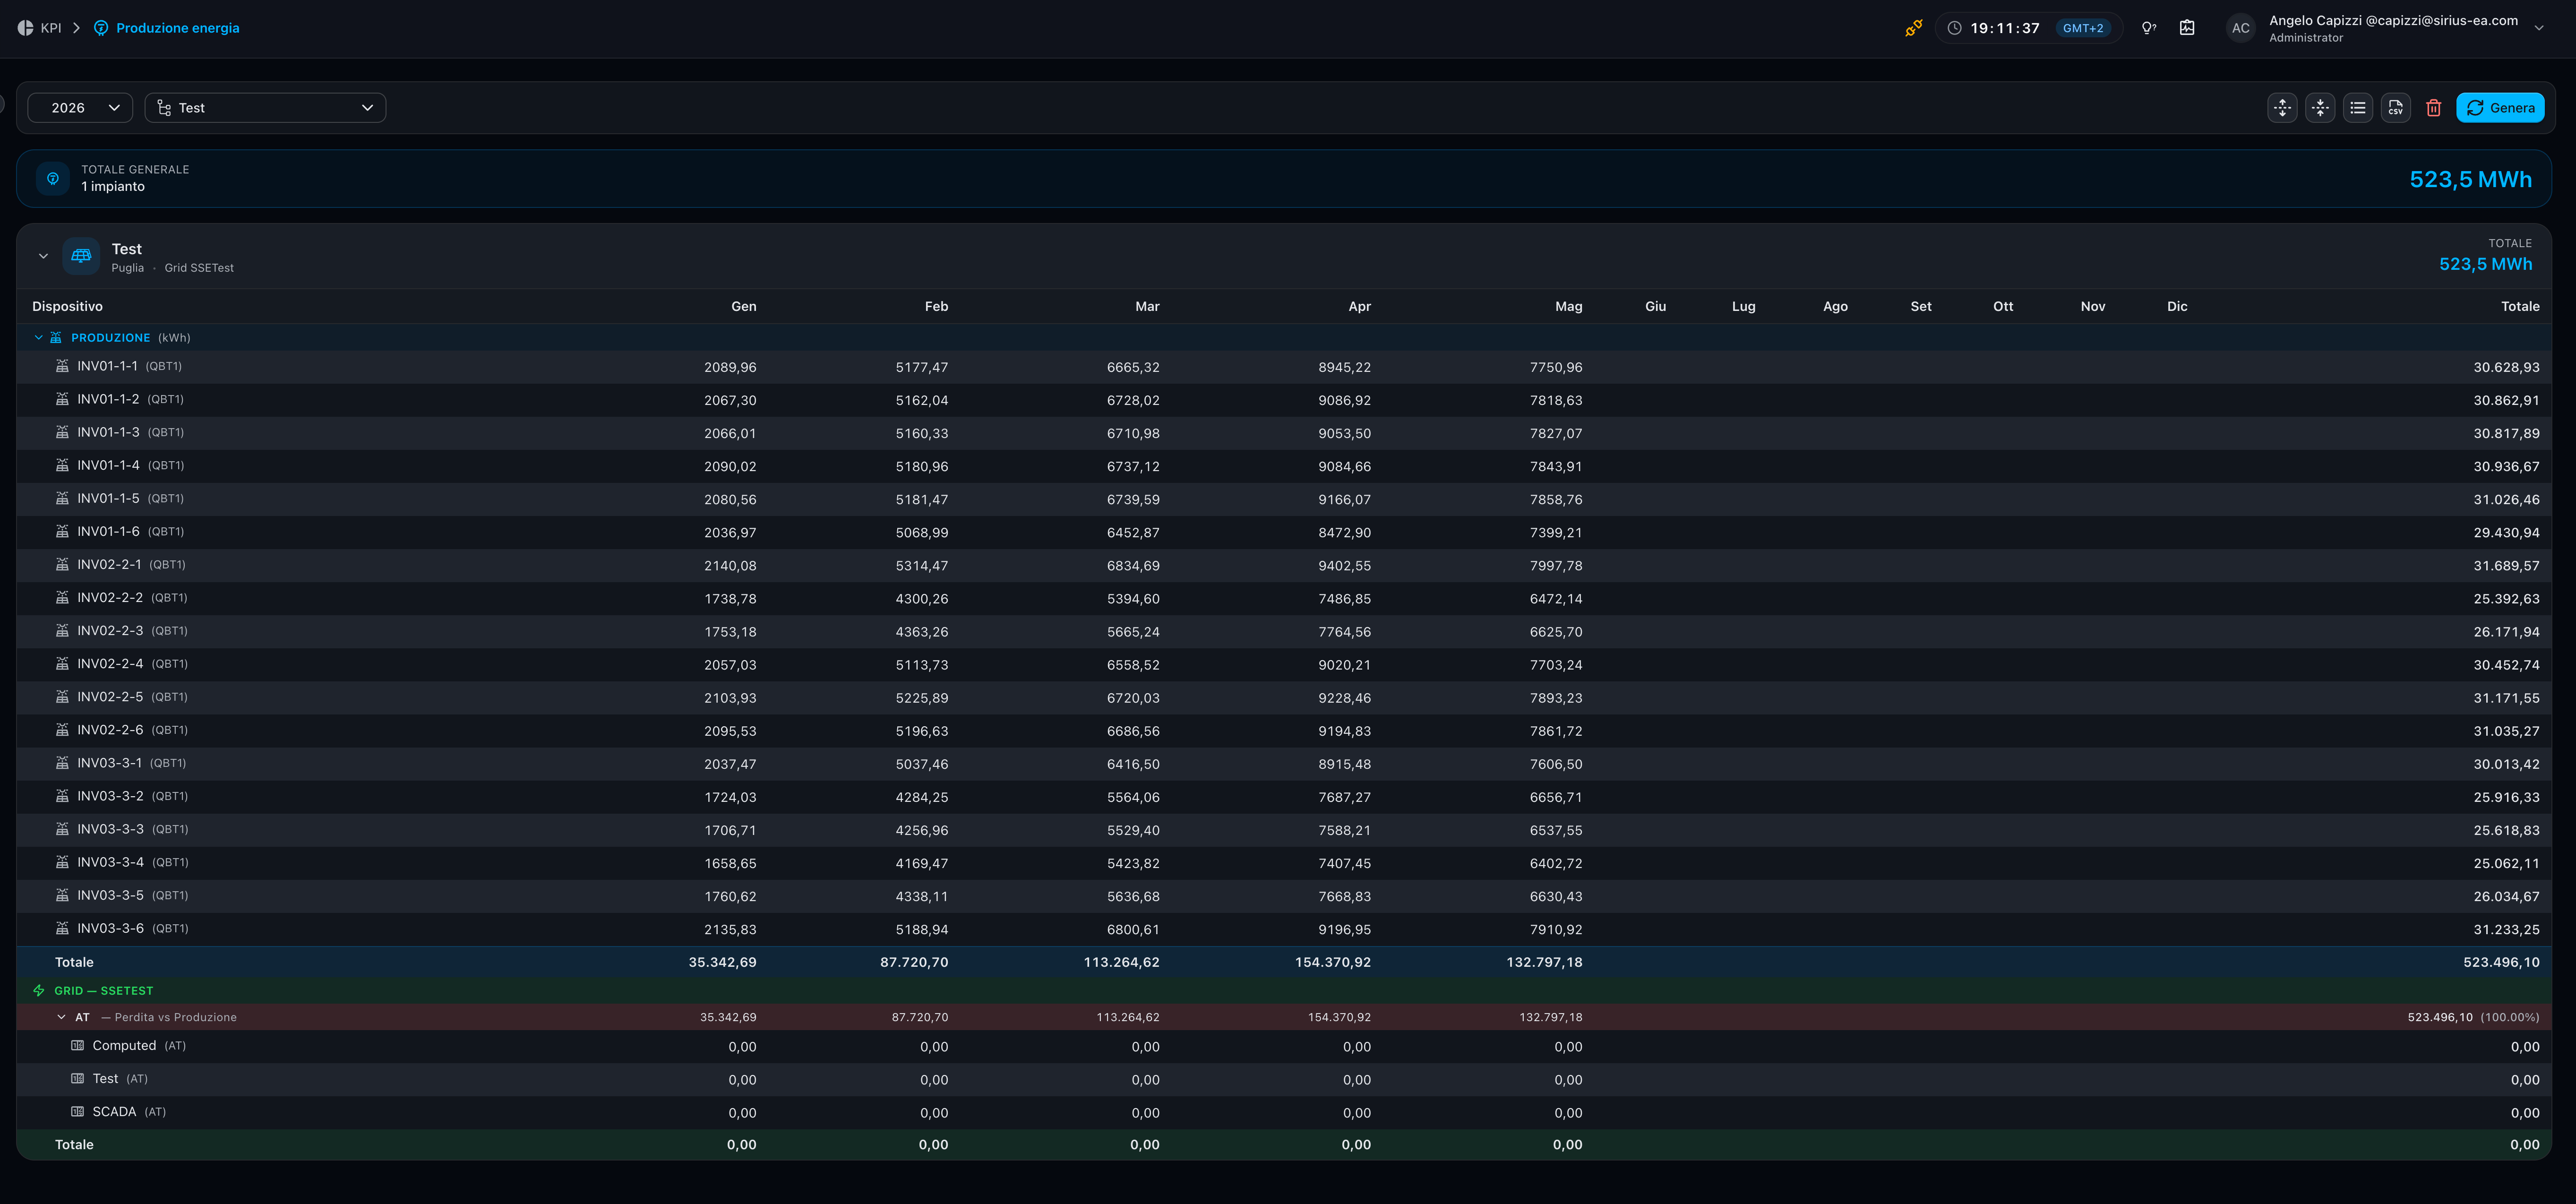
The page tells you at a glance:
- how much energy each plant device produced month by month;
- how much of it reached the fiscal counters at each voltage level of the associated Grid;
- how much was lost in the intermediate transformations and at which percentage.
Data arrives in progressive streaming: as soon as a device or counter is ready it appears in the table, without waiting for the whole plant to be computed.
Toolbar


On the left:
- Year — reference year selector. For past years the future months are empty; for the current year the months not yet elapsed are empty, past months with a zero value display
0.00, months with no data display-/-. - Plant selection — plants tree. Both photovoltaic and wind plants are included: PVP plants sum their inverters, wind plants sum their turbines.
On the right:
- Expand all ( ) / Collapse all ( ) — opens or closes every plant card in one click.
- Legend — opens the legend dialog.
- Export CSV — downloads the data as CSV.
- Clear results — empties the page keeping the current selection.
- Generate — runs the query for the selected year and plants. While loading, a progress banner appears with the option to abort.
autoLoad, the search starts on its own.Plant card
Every plant is a collapsible card. The header shows the plant icon, its name, the region, the linked Grid name and the annual production total.


Click the header to expand or collapse. A card that is still loading shows a Partial badge until all data is ready.
The table inside is split into two independently collapsible sections: Production and Grid.
Production section
Lists all production devices of the plant, ordered by section and then by name (numeric-aware, so INV01-1-2 precedes INV01-1-10).
Each row contains the monthly kWh and the annual total. The Total row at the bottom is the sum of every device.
Click the "Production" header to collapse the whole section: the total row remains visible.
Grid section
Shown only when the plant is linked to a Grid. It opens with the GRID — <Grid name> row and contains, in order, the voltage levels present: BT, MT, AT.
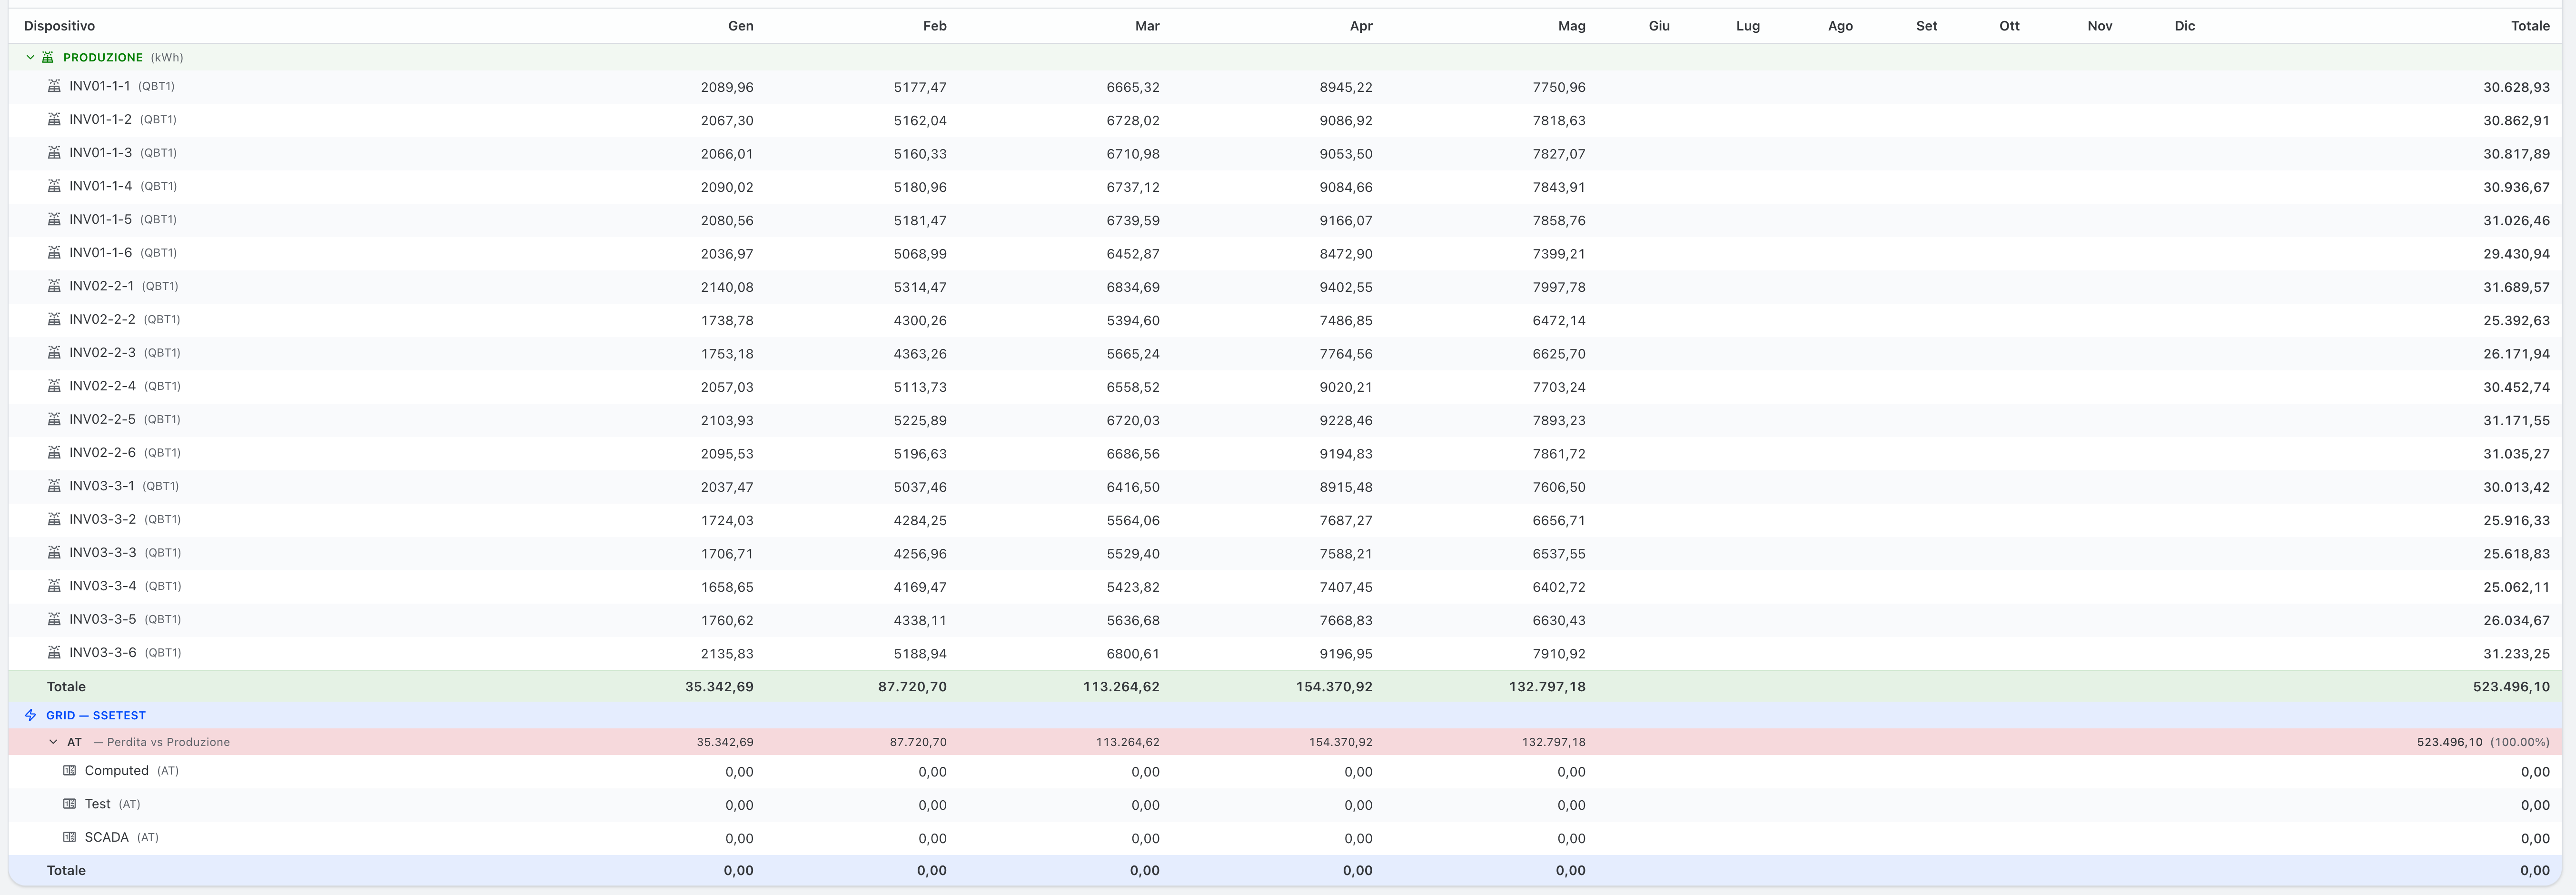
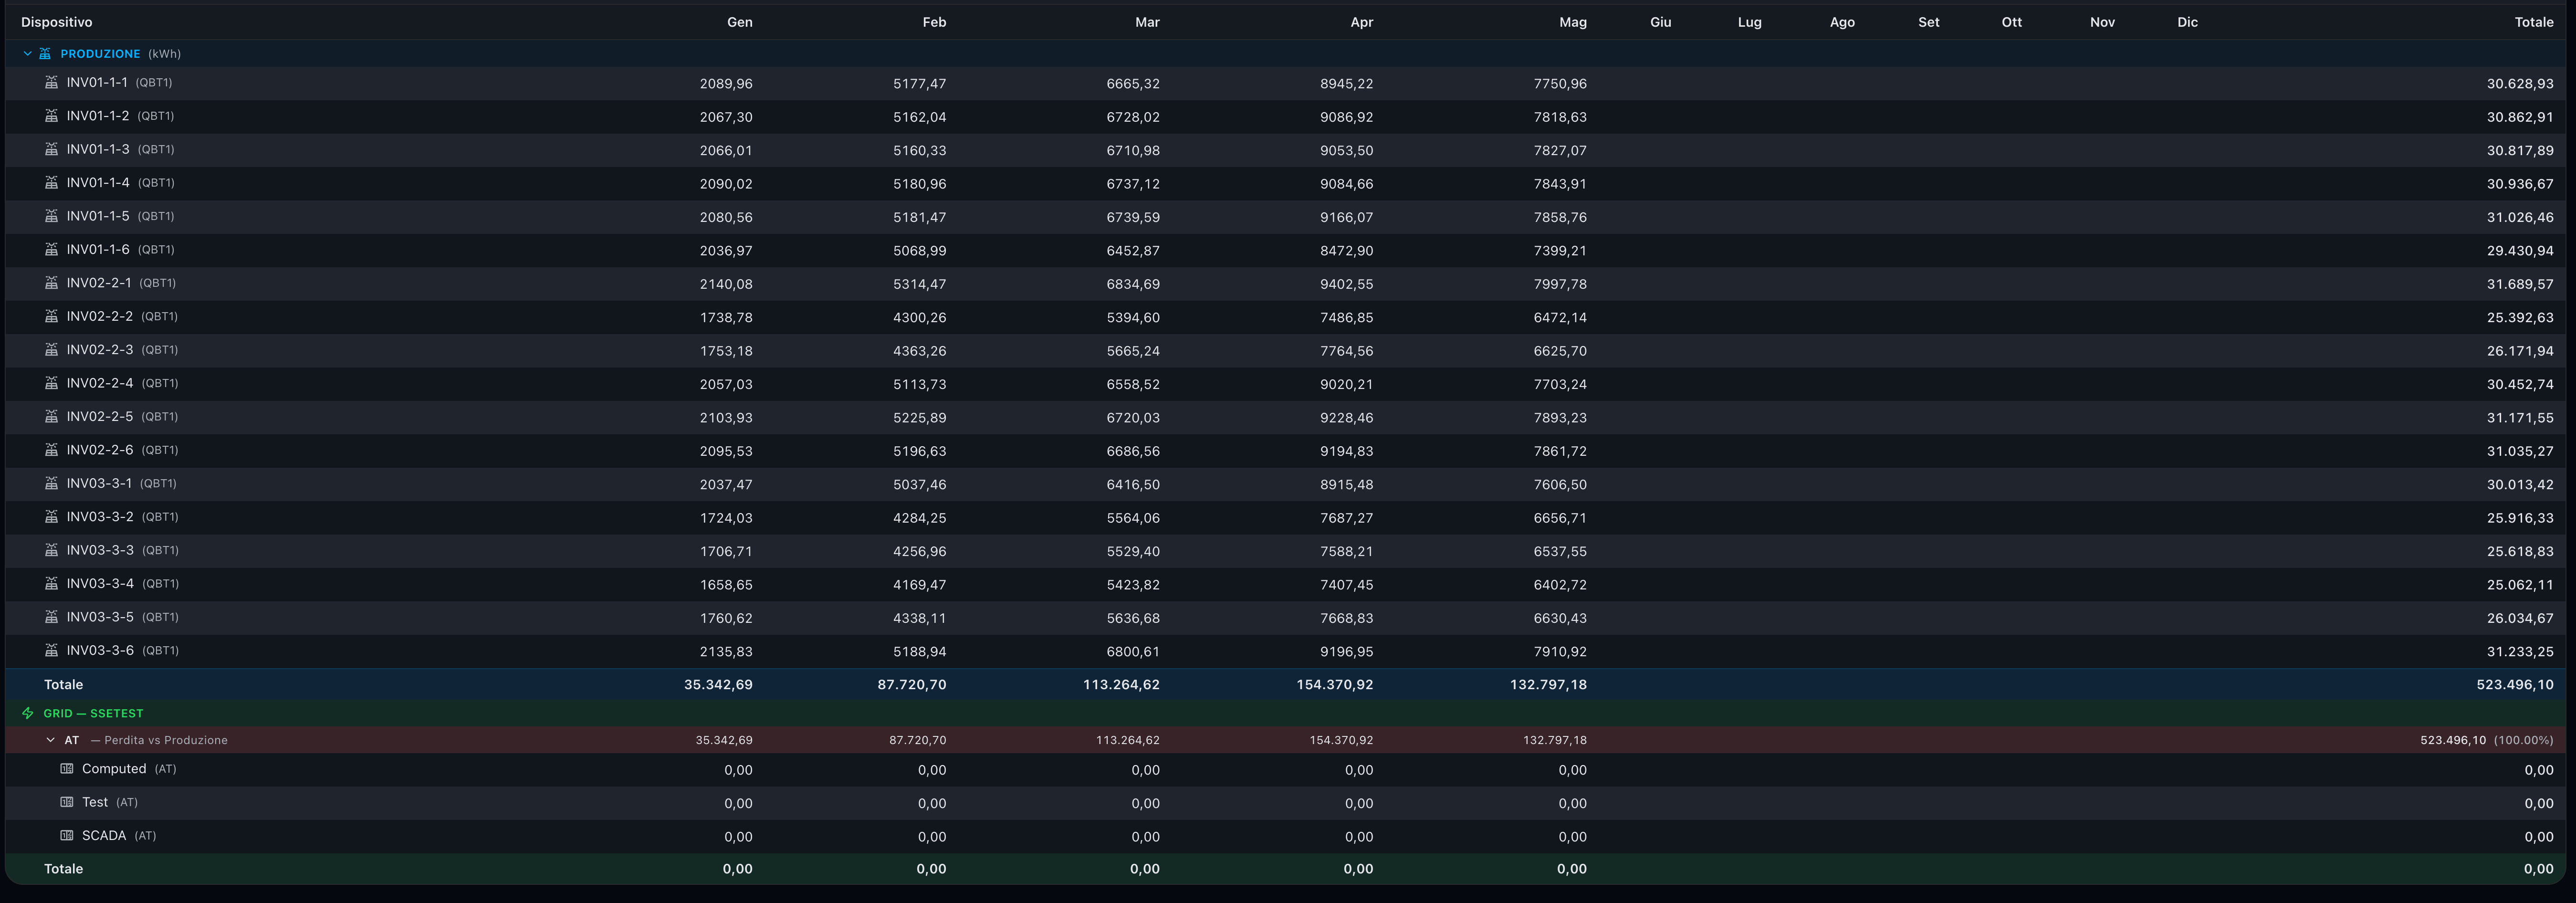
For every level:
- Level row (e.g.
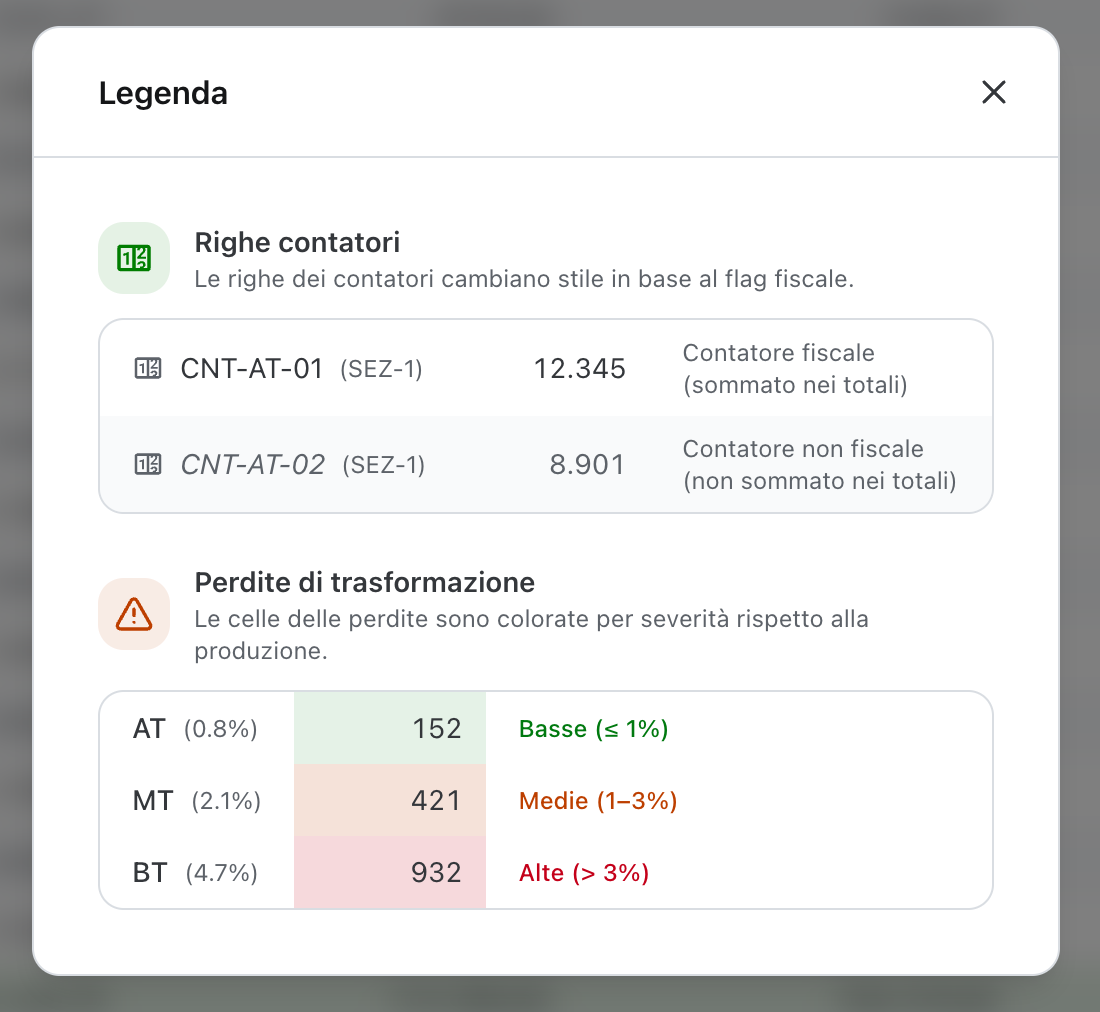
AT — Loss vs Production): a clickable header that collapses or expands the group. When a transformation loss exists, the row is tinted green/amber/red according to severity and the monthly cells directly hold the loss values, with the percentage on the right. - Counters of the level, ordered alphabetically by name. A counter marked as non-fiscal is rendered in grey and is not included in the totals.
- Total of the level — sum of the fiscal counters only.
Transformation loss
Loss is computed progressively along the energy transformation chain:
| From → to | Meaning |
|---|---|
| Production → BT | difference between total device production and the BT fiscal sum |
| BT → MT | difference between the BT fiscal sum and the MT fiscal sum |
| MT → AT | difference between the MT fiscal sum and the AT fiscal sum |
The percentage is the absolute loss compared to the previous level. The row colour follows three thresholds:
| Colour | Threshold | Label |
|---|---|---|
| Green | ≤ 1 % | Low |
| Amber | 1 – 3 % | Medium |
| Red | > 3 % | High |
If a level has no fiscal counters, its loss row is skipped: the chain moves on to the next level.
Legend
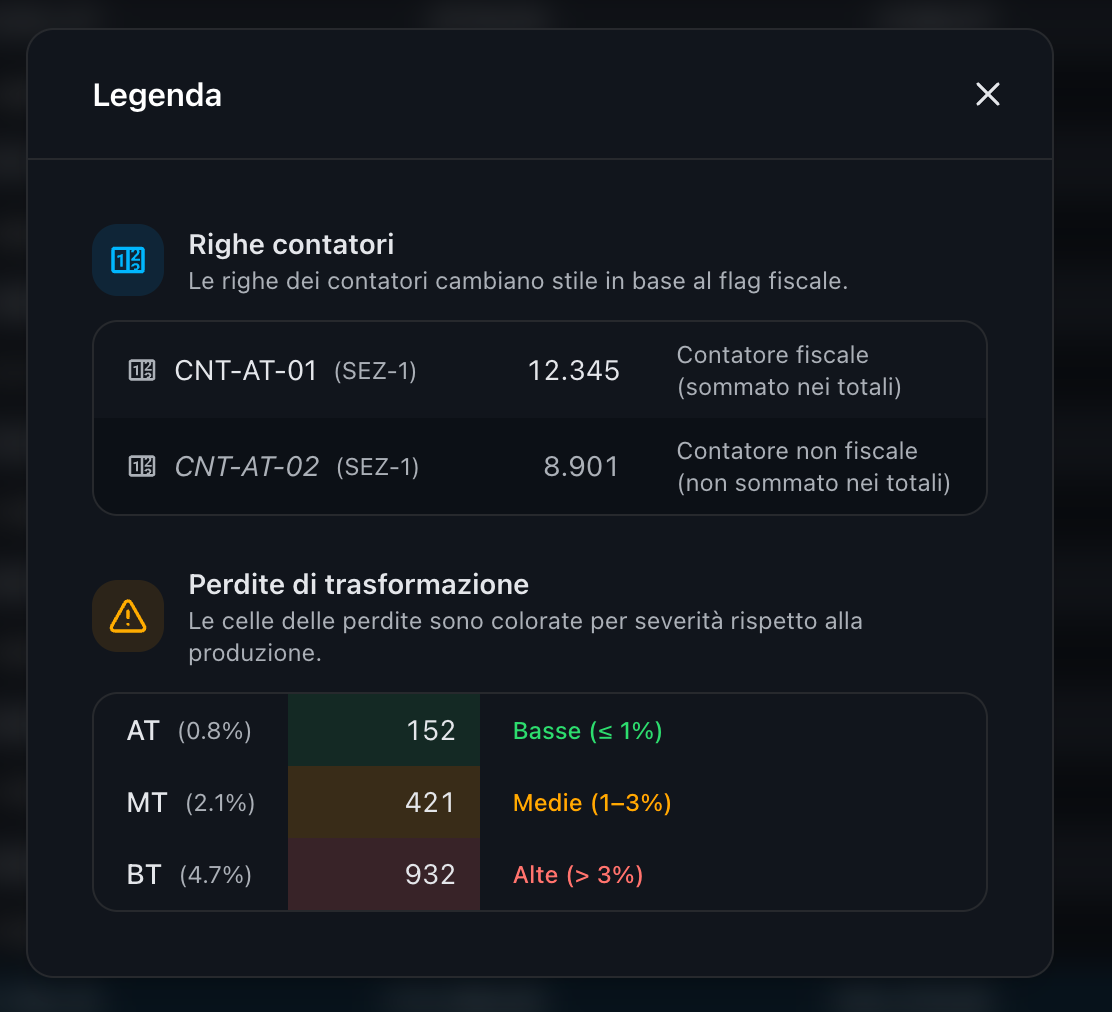
The Legend button in the toolbar opens a dialog explaining:
- the difference between a fiscal and a non-fiscal counter;
- the three loss severity levels and their thresholds.
CSV export
The CSV button downloads a file with the monthly detail of every device and counter of the currently visible plants. The file contains:
- a comment row
# Year: <yyyy>as header; - a header row with
Plant | Section | Device | Jan … Dec | Total; - one section per plant, separated by an empty row;
- per plant: rows for the devices + Production total, rows for each counter per voltage level + fiscal total, rows for Transformation losses per level.
Numbers are formatted in the user's locale (comma or period as decimal separator) and always use two decimals.