
Equivalent Hours
The Equivalent Hours page computes, over a calendar year, the equivalent operating hours of every device of a photovoltaic or wind plant and compares them against a theoretical target.
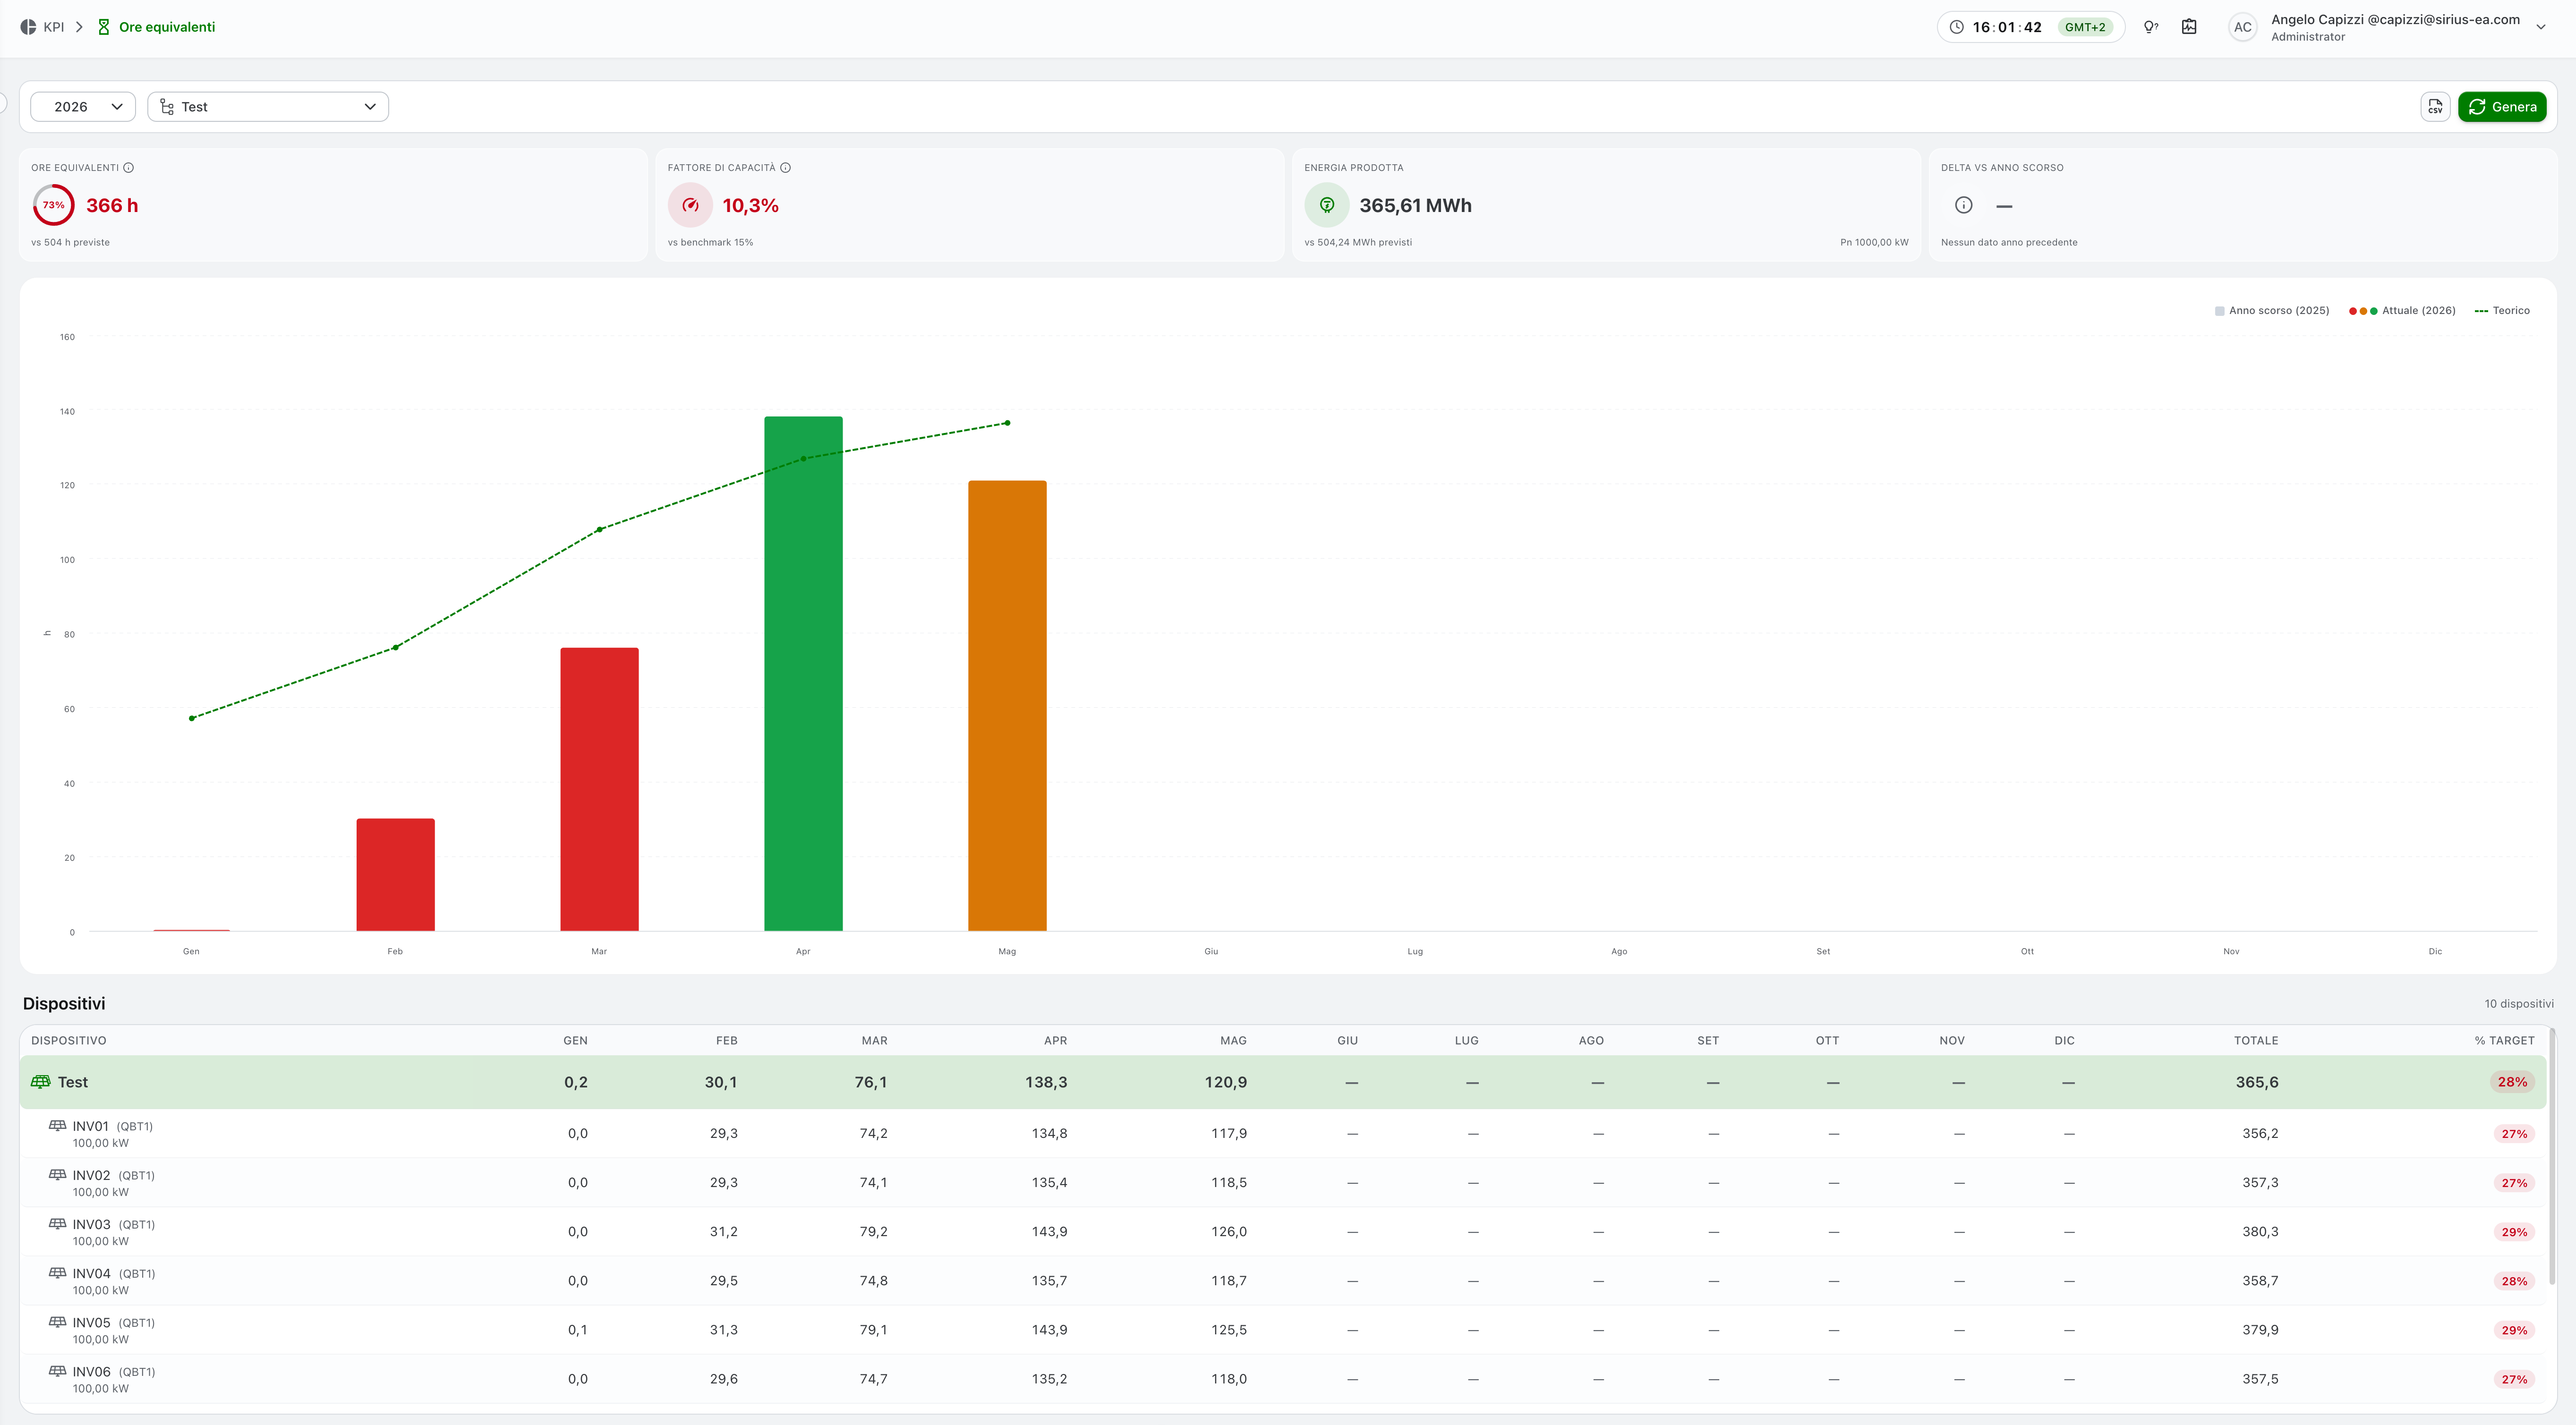
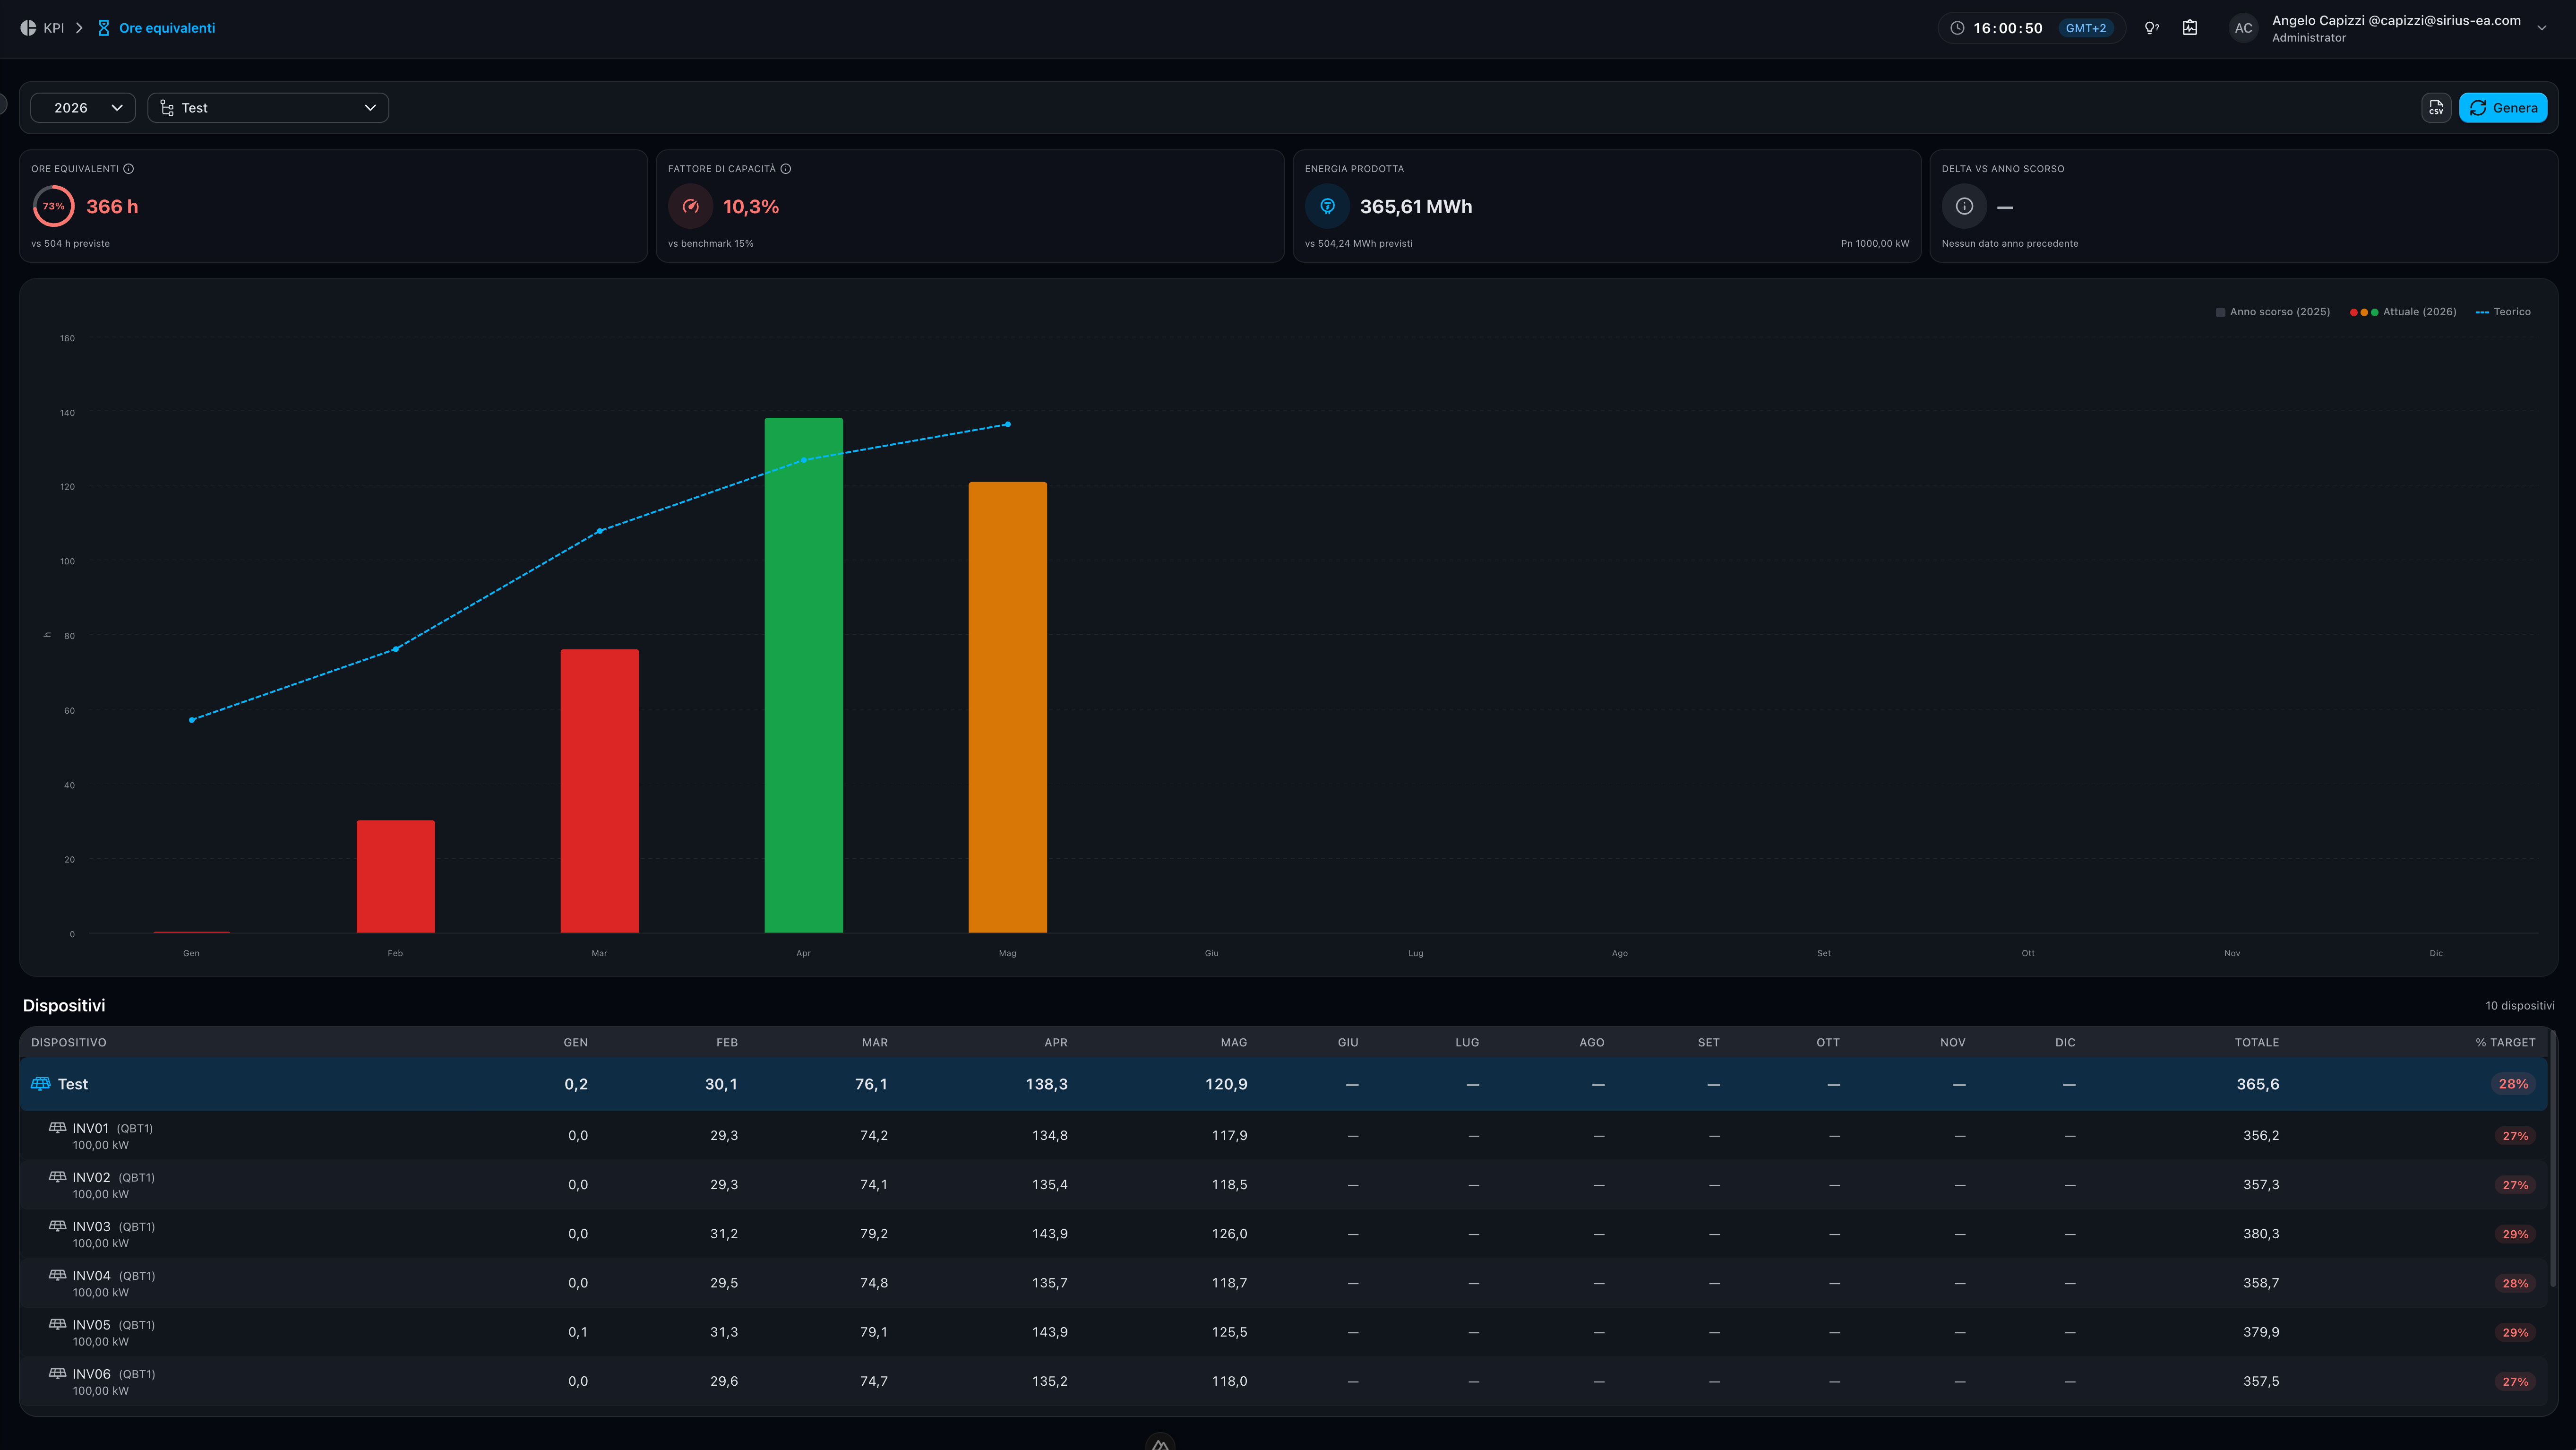
Equivalent hours are the number of hours a device would have had to run at full nominal power to produce the energy actually recorded:
equivalent hours = energy produced (kWh) / nominal power (kW)
It lets you read at a glance:
- how many equivalent hours each device accumulated month by month;
- how far the actual performance deviates from the theoretical target expected so far;
- the capacity factor and the comparison with the previous year.
Data arrives in progressive streaming: as soon as a device is ready it appears in the table, without waiting for the whole plant to complete.
Toolbar
On the left:
- Year — reference year selector, capped at the current year.
- Plant selection — plant tree, single selection.
On the right:
- Export CSV — downloads the data in CSV format.
- Generate — runs the calculation for the selected year and plant. While loading the button is disabled and a progress banner shows the device being processed.
Summary indicators
Above the chart a strip of four cards summarises the performance of the selected device (or of the whole plant).


- Equivalent hours — current value with a progress ring showing the percentage against the hours expected so far. The icon opens the colour legend; the annual target is also reported at the bottom.
- Capacity factor — fraction of the elapsed time in the year during which the plant produced at nominal power, compared against a benchmark. The icon explains its computation.
- Energy produced — total energy for the period (with automatic MWh/GWh scaling) and installed nominal power (Pn).
- Delta vs last year — percentage change in equivalent hours against the same period of the previous year. If there is no previous-year data,
—is shown.
Performance thresholds
The equivalent hours value and the capacity factor are coloured based on how close they are to their respective reference:
| Colour | Threshold | Label |
|---|---|---|
| Green | ≥ 95 % | Good |
| Amber | 80 – 95 % | Below target |
| Red | < 80 % | Critical |
Hours expected so far
The annual theoretical target is distributed across the twelve months following the plant's seasonality curve — photovoltaic peaks in summer, wind in autumn-winter. The hours expected so far are the sum of the months already elapsed plus the share of the current month proportional to the days passed.
Comparing actual hours with those expected so far — rather than with the full annual target — avoids appearing "behind" simply because the year is not over yet.
Monthly chart
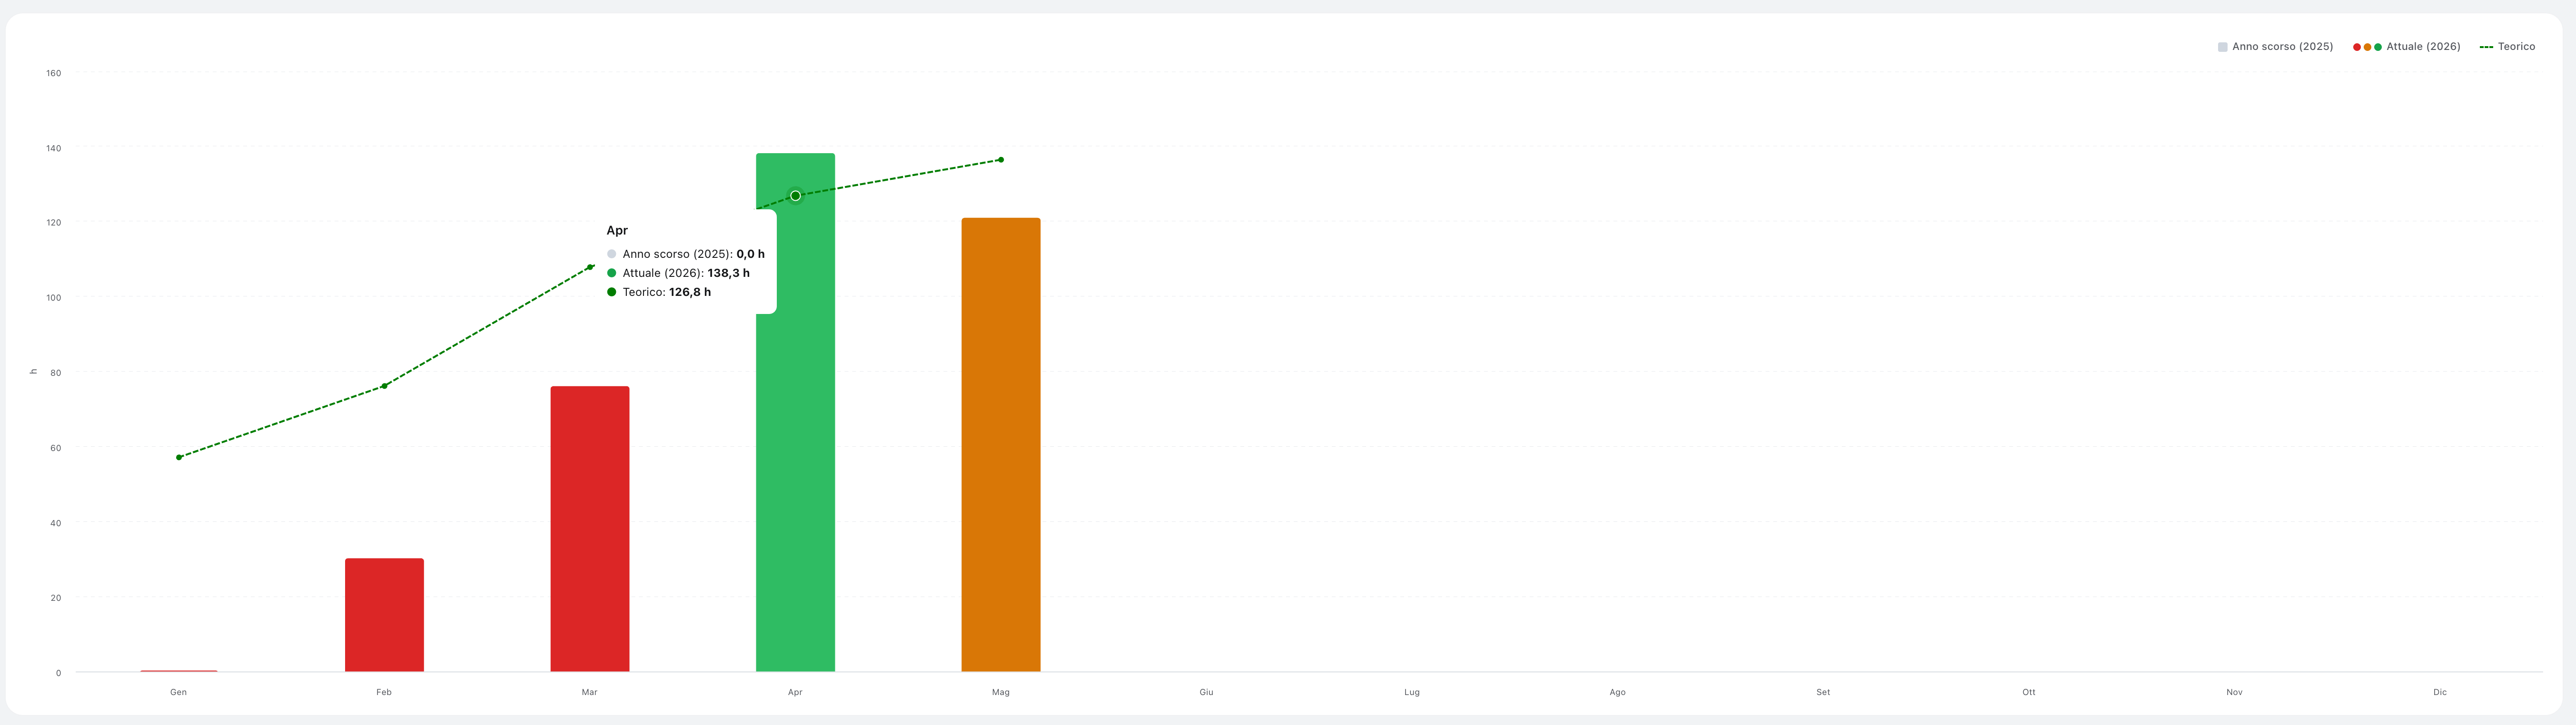
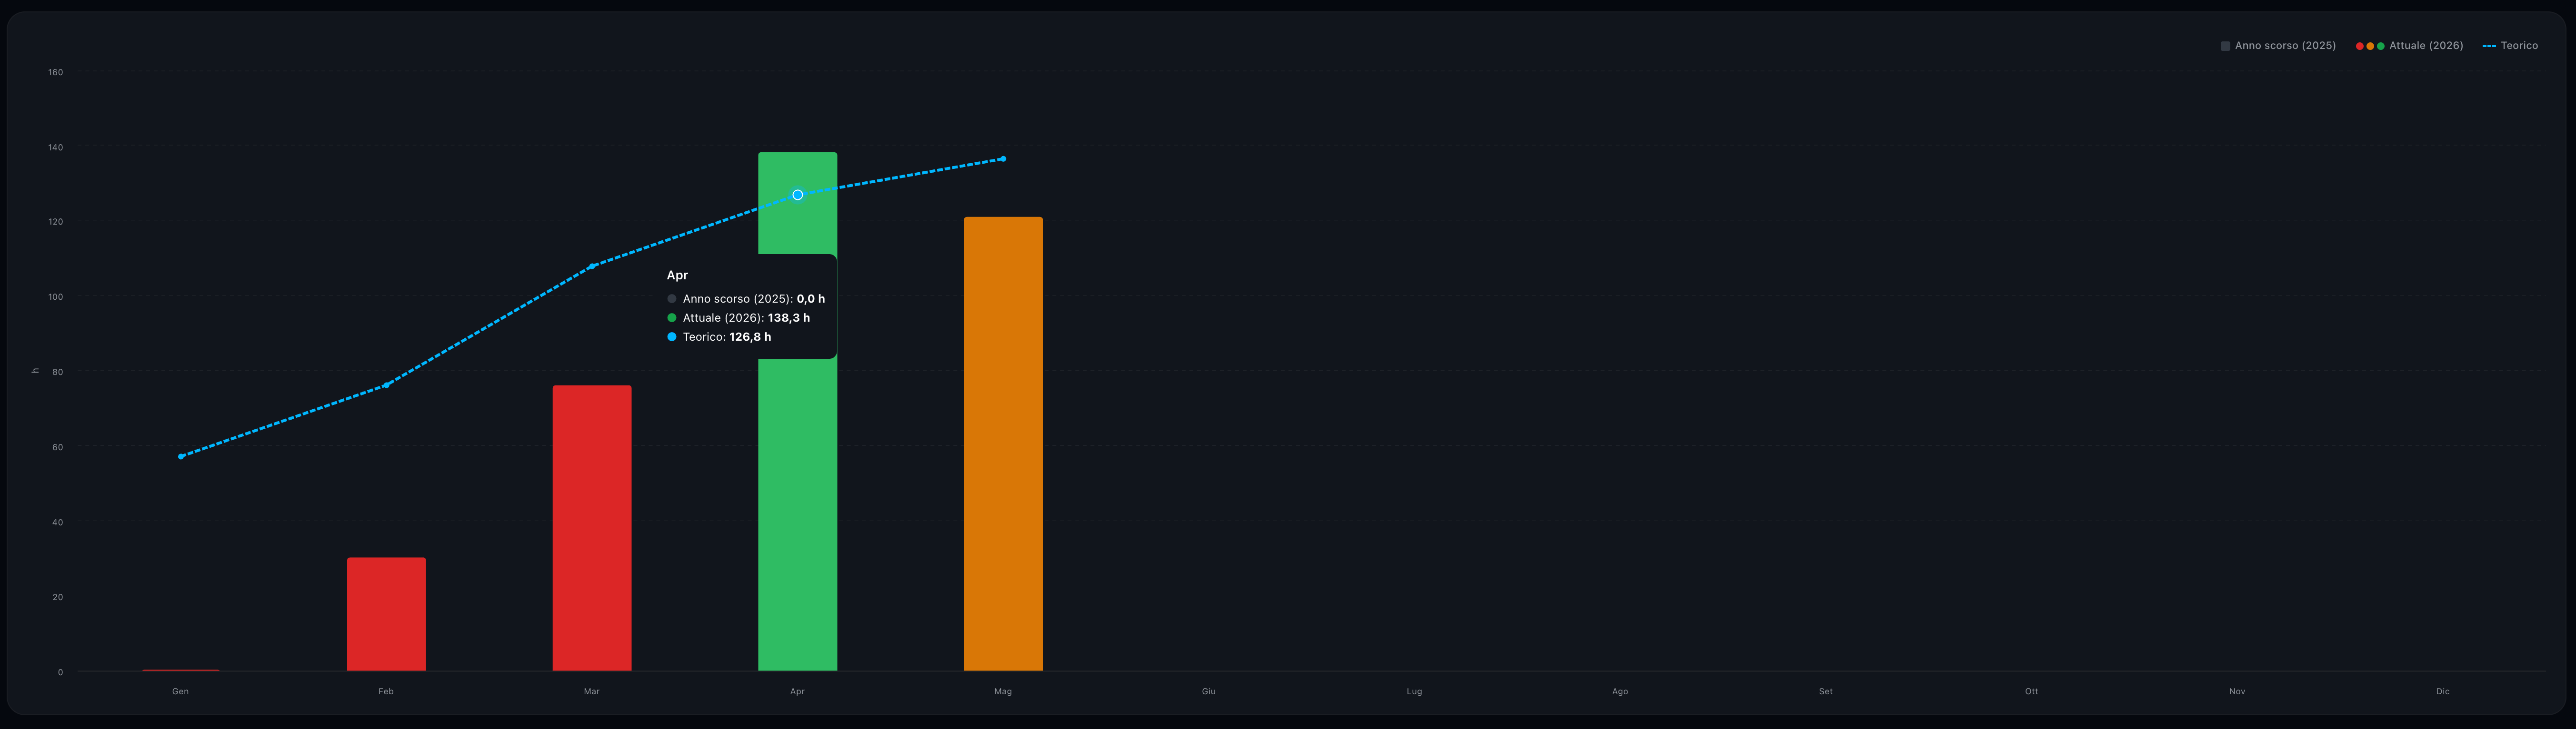
The chart shows, month by month:
- the actual equivalent hours (columns coloured by performance threshold against each month's target);
- the previous year equivalent hours (grey comparison columns);
- the dashed theoretical line, clipped at the current day: future months have no theoretical reference and stay empty.
Selecting a row in the table below makes the chart show that single device's series; the plant total is the default selection.
Devices table


The first row is the Plant total, highlighted; the following rows are the individual devices (inverters or wind turbines), indented and ordered by name (numeric-aware comparison, so INV01-1-2 precedes INV01-1-10).
Each row contains the monthly equivalent hours, the annual total and the % target coloured according to the thresholds above. Clicking a row updates the chart to the chosen device. While loading the table shows all rows at full size right away, with a Partial badge until the data is complete.
CSV Export
The CSV button downloads a file with the month-by-month detail of all the plant's devices. The file includes:
- an Equivalent hours section for the selected year (plant total + each device);
- an Equivalent hours section for the previous year;
- an Energy produced section.
Each row reports the twelve monthly values and the total. Numbers are formatted in the user's locale (comma or dot as decimal separator) and always use two decimals.